Build-it Stats | November 2019
Hi everyone and please welcome to our monthly stats. These posts will be coming each month and we will represent data for our platform. We are starting out with the stats for November 2019! A lot of interesting information for your tribe.

We will be looking at the number of tokens issued, top earners, staking, activity on the web, prices etc.
The following topics will be covered:
- Tokens distribution (Issued Build tokens),
- Top Earners for the month
- Staking and top Stakers
- Share of tokens staked
- Number of users
- Posts and comments activities on the platform
- Posting from build-it.io interface,
- Price Chart
Issued BUILD Tokens
Let’s take a look into token distribution, inflation and how it is distributed.
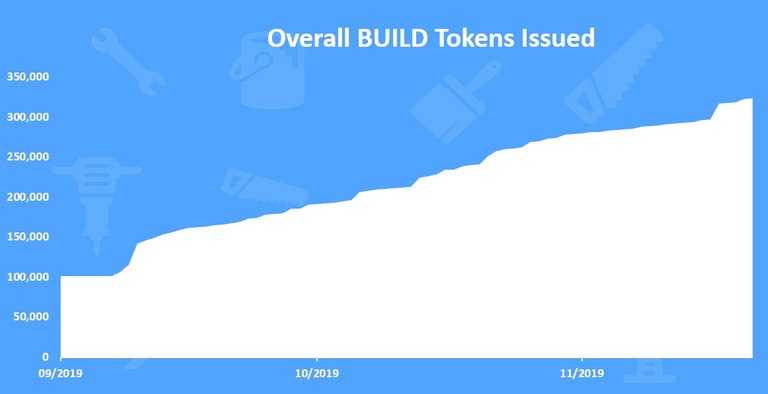
Below is a chart that represents the cumulative issued BUILD token.

A total of 324k BUILD tokens issued till November 2019.
The number of tokens started with 100k and then growth over time.
Now let’s see the daily issued tokens for November 2019.
Here is the chart.

Note: Issued tokens are claimed token that are put in circulation. They are different from the inflation.
Since the platform is new, we can see that there are a few spikes in the issued tokens daily. On November 26th there is a 19k tokens issued due to a large claim from an admin account.
On average there is around 2000 BUILD tokens issued daily. In November 2019 the total amount of issued BUILD tokens is 66,158 tokens.
Top 10 BUILD Earners for the period
Now that we saw how the numbers on the tokens are issued let’s see how those are being distributed. How much do the top 10 received and how much the rest? How many accounts earned BUILD tokens?
Here is the chart of the Top 10 BUILD earners in the period.

On the top is the build official account @build.it curator with 25,162 tokens, followed by @hertz.diy with 6k and @aellly with 1100 tokens.
Out of the 66k issued tokens in the month, the top 10 earned 39k or 59% share of the reward pool.
Staked Tokens
Staking is an important part of the tokenomics as it shows how much of the tokens are out of the market and put in use.
Below is the chart with overall BUILD staked tokens.

The staking started in September and it continue to grow since then.
Now the daily staking for the last month.
Here is the chart of the net staked tokens for the month.

A total of 44,689 BUILD tokens staked in the month.
The charts include net staking for each day and there is only one day with negative net staking in the period, meaning there was one day with more tokens unstaked than staked. The unstaking period for the BUILD token is 7 days.
Top 10 BUILD Stakers in the period
Who is doing the staking? Here is the chart of the Top 10 BUILD stakers in the period analyzed.

On the top is the build official account @build.it curator with 10,706 tokens staked, followed by @divers with 7,753 and @monsterjamgold with 1100 tokens.
Share of Tokens Staked
Below is a chart of the ratio staked/unstaked BUILD tokens.

A 77% tokens staked!
This is a nice result meaning that users are staking their tokens and use their stake.
Out of the current supply 324k tokens, around 250k are staked, and 74k are liquid at the end of November.
BUILD Users
How is the BUILD community doing with the number of users?
Below is a chart with the number of unique users that posted on the Build-it web. These are users that posted directly from the web.

A total of 61 unique user have posted from the Build-it frontend.
The users who posted from other frontends and included the tag #build-it are not included in the chart above.
Activities on Build-it
Below is a char of the activities on Build-it, including posting and commenting from the Build-it interface and posting and commenting with the #build-it tag.

We can see that the majority of the posting still comes from other interfaces with the tag #build-it. Interesting to see that there is a lot of commenting on the build-it frontend.
Here is the chart only for posts from build-it interface.

There is still not as much of posting from the frontend, but as mentioned the number of comments is doing much better.
Posts and comments from the Build-it interface
Below is the chart on the posts and comments from the Build-it web, in the period.

A total of 23 post in November with 527 comments on the frontend. Great number of comments and engagement.
Price
Here is the price chart for the BUILD token with daily candles.

The build token has stabilized around the 0.02 STEEM in the last few months.
Congratulations @build-it.stats! You have completed the following achievement on the Steem blockchain and have been rewarded with new badge(s) :
You can view your badges on your Steem Board and compare to others on the Steem Ranking
If you no longer want to receive notifications, reply to this comment with the word
STOPVote for @Steemitboard as a witness to get one more award and increased upvotes!
Congratulations @build-it.stats!
Your post was mentioned in the Steem Hit Parade for newcomers in the following category: